Is Nashville Oversupplied With Short-Term Rentals? The Permit Data Says No
Permits are down. Bookings are up 20%. So why does everyone keep saying Nashville is oversupplied? We pulled the permit data, the booking data, and the macro data to find out.
Permits are falling. Bookings are climbing. The problem everyone keeps describing is not the problem the data shows.
If you own a short term rental in Nashville, you have heard it at dinner, in group chats, and from at least one lender this year. Rates are down. Everyone and their cousin bought an Airbnb. The market is saturated. Is Airbnb over in Nashville?
We manage roughly 190 properties and around 20,000 reservations a year in this city, and we pull the market data every week. So we went looking for the oversupply. We could not find it. That is the vantage point of a company doing short term rental management in Nashville at scale, not a lender's spreadsheet.
What we found instead is a market with fewer legal STR permits than a year ago, more guests than a year ago, and a nightly rate held flat by an economy that is squeezing travelers and owners at the same time. Those are very different problems with very different answers.
232 fewer net STR permits, last 12 months. 617 issued vs 849 lapsed.
529.55K bookings, last 365 days. Up 89.33K (+20%) vs same time last year.
57% estimated occupancy. Up 2 pts vs same time last year.
$267 average daily rate. Down $2 (under 1%) vs same time last year.
The myth: too many units, not enough guests
The oversupply story goes like this. Nashville got hot, investors poured in, every block in East Nashville and Germantown got an STR, and now there are simply too many rooms chasing too few travelers. Prices fall, occupancy falls, and the smart money is heading for the exit.
It is a clean story. It is also the same story people tell about hotel rooms every time a new tower goes up downtown. The trouble is that it makes a specific, testable claim: supply is growing faster than demand. So let's test it.
Own a short-term rental here, or thinking about buying one? Host Extraordinaires runs full-service Nashville Airbnb management for owners who want the bookings without the day-to-day. See how short term rental management in Nashville works, what it costs and what your home could earn.
Supply: the permit count is shrinking
In Nashville, you cannot legally operate a non owner occupied STR without a permit from Metro. That makes the permit database the cleanest supply number available. Here is what it shows right now.
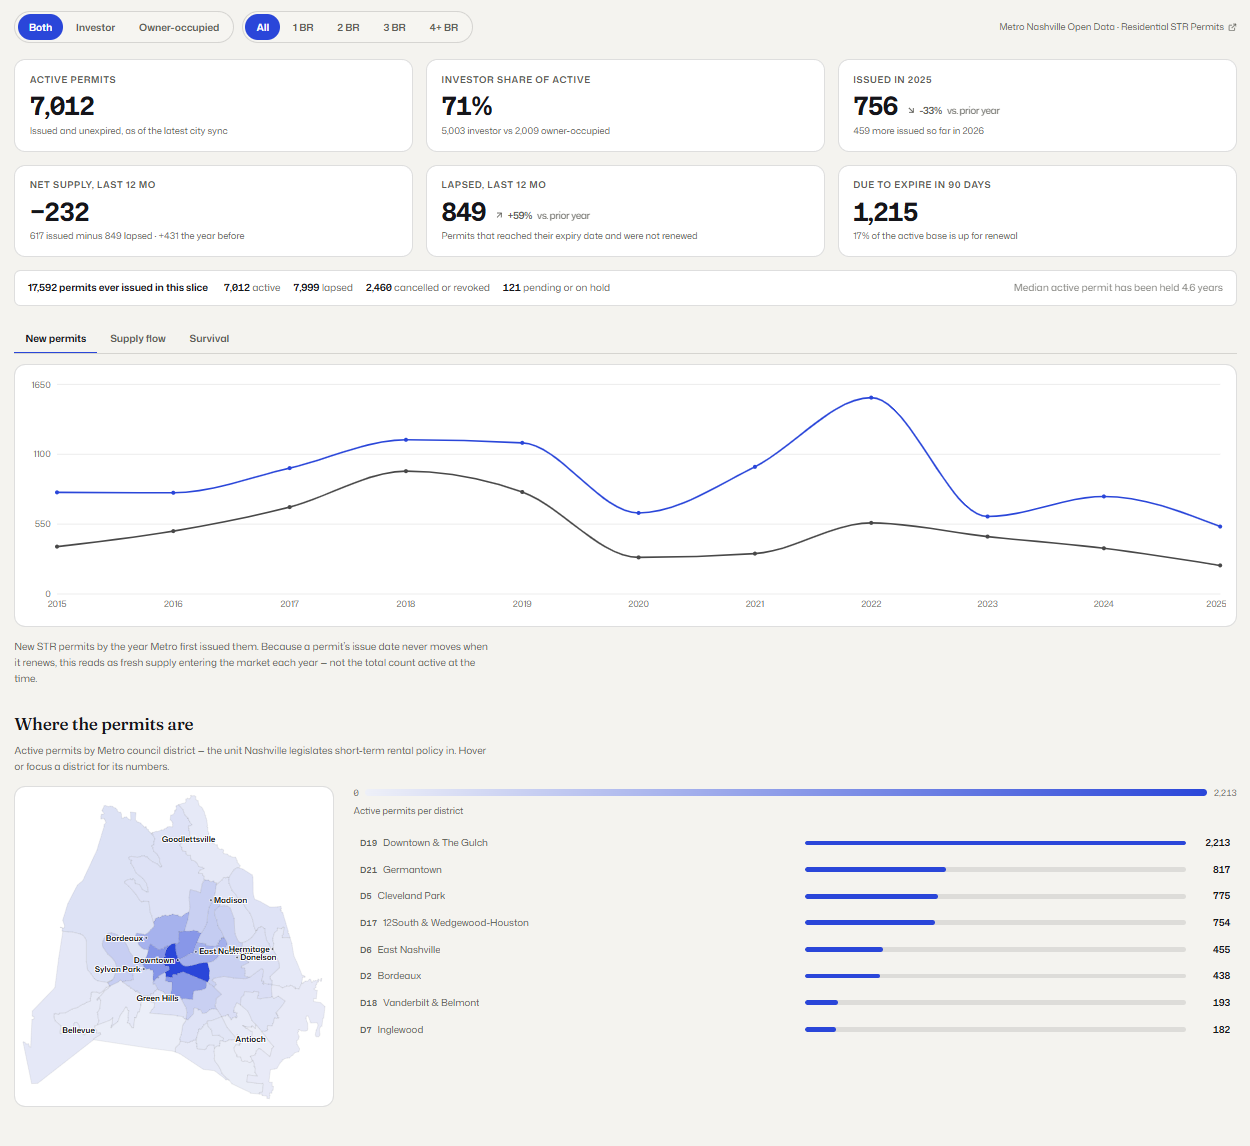
Read those numbers slowly:
7,012 active permits in the entire county.
756 new permits issued in 2025, down 33% from the year before. Another 459 so far in 2026.
849 permits lapsed in the last 12 months, up 59% from the prior year. These are owners who reached their expiration date and chose not to renew.
Net supply over the last 12 months: 232 fewer permits. The year before, the market added 431.
1,215 more permits (17% of the active base) come up for renewal in the next 90 days.
New permit issuance peaked in 2022 at over 1,500 and has fallen off a cliff since. Nashville's legal STR supply is not growing. It is contracting.
For the longer arc, from the 2022 permit peak through the 2025 correction to the first year-over-year decline in active listings, see our 2026 Nashville STR market report.
Over the last 12 months, Nashville lost 232 STR permits. Oversupply does not usually look like a shrinking permit count.
"But there are more listings than ever"
This is where the confusion comes from. PriceLabs shows 11.18K available listings over the last 365 days, up 989 from the same time last year. If you only look at that number, it looks like supply is exploding.
But a listing is not a property, and it is definitely not a permit.
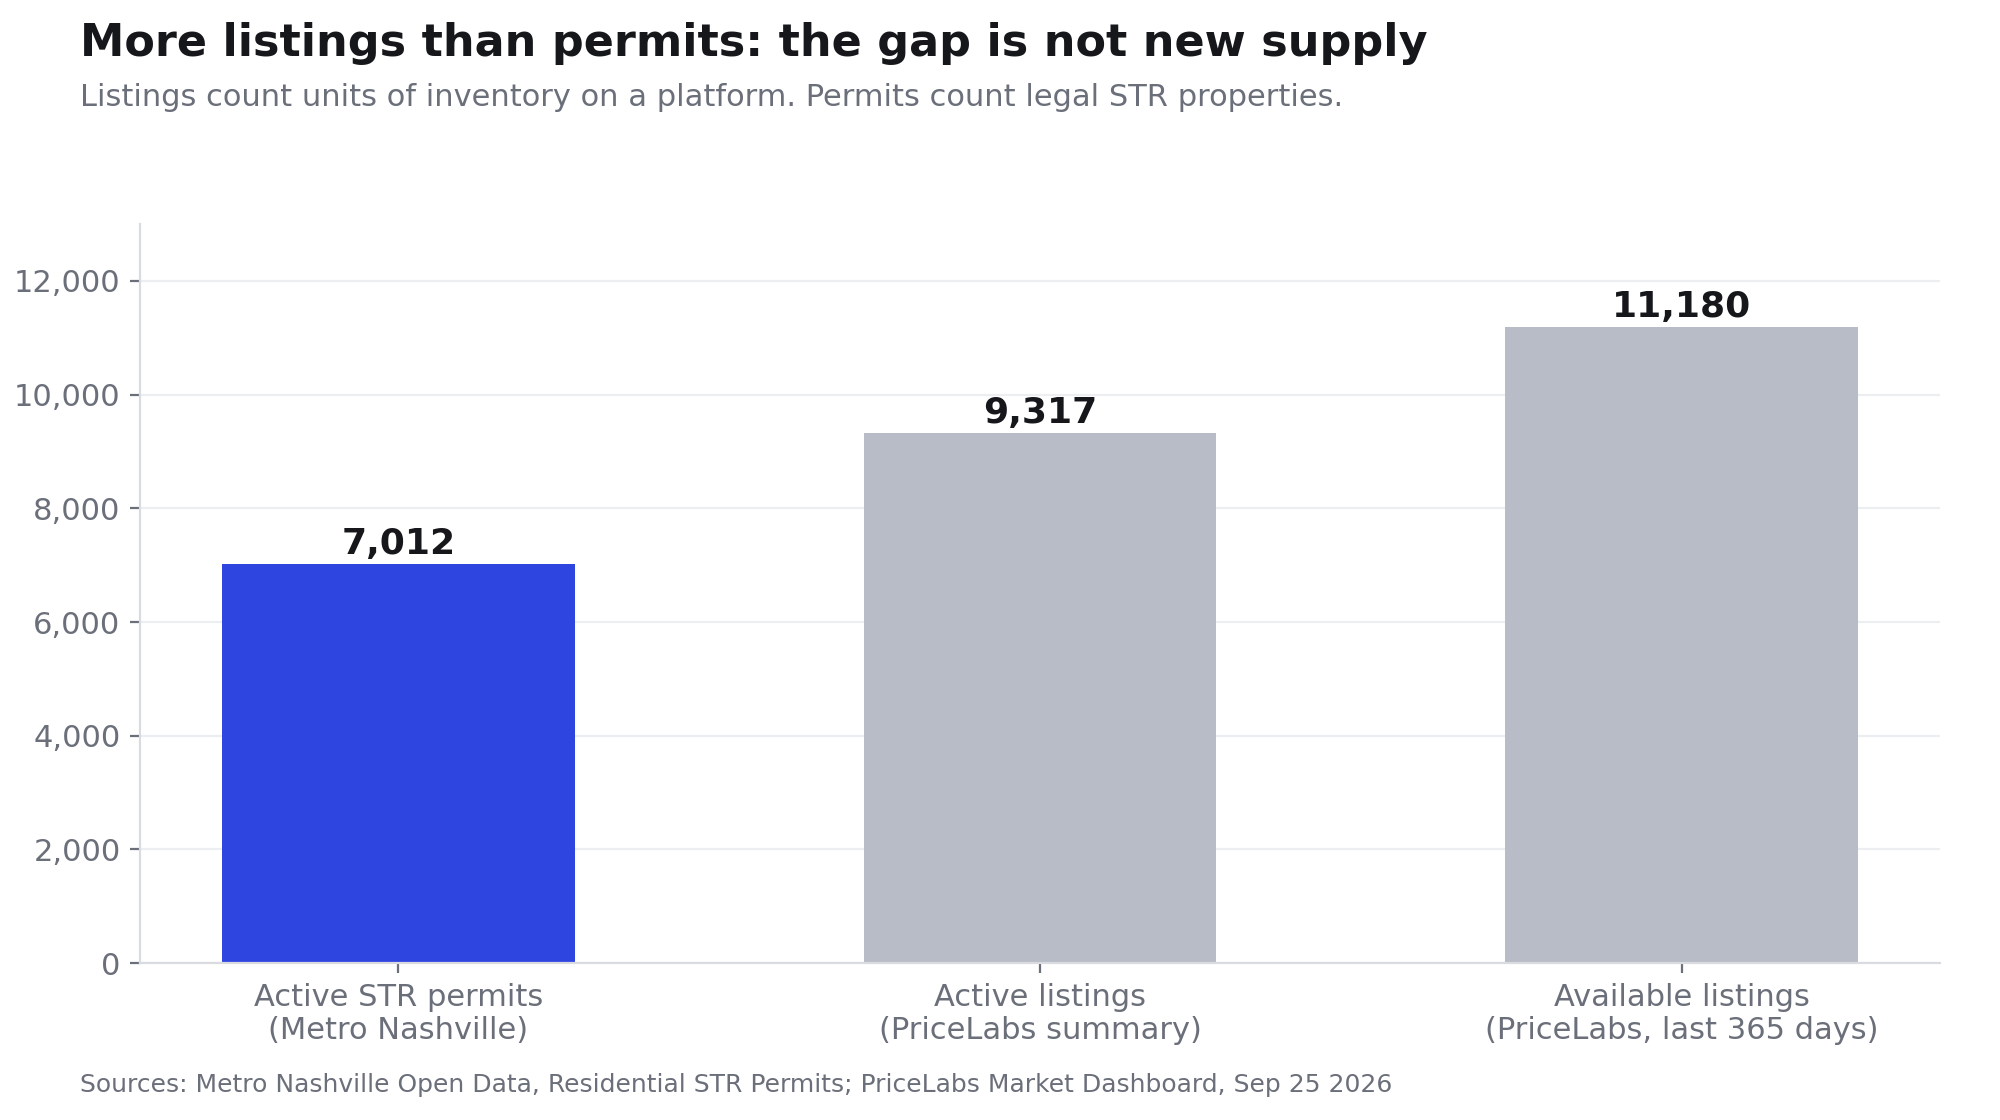
The gap between roughly 7,000 permits and roughly 11,000 listings comes from things like:
One property, multiple listings. An owner lists the whole house, the main unit, and the carriage house separately. One permit, three listings.
Rooms inside a single home. PriceLabs counts 756 active "Room" listings in Nashville.
Stays of 30 nights or more. Monthly stays do not require an STR permit, and they are a real slice of this market: 29+ night stays accounted for 11.7K booked nights in recent bookings. Owners who let a permit lapse often keep the listing live for longer stays.
Owners toggling between STR and long term. A home that runs short term part of the year and goes on a lease the rest shows up as available inventory without adding a single permitted property.
So yes, there are more listings. There are not more legal STR properties. The active listing count in the PriceLabs supply chart has sat right around 10K for two years and ended this period near 9.6K. The market is rearranging its inventory, not adding to it.
Demand: more guests than a year ago
Now the other side of the ledger. If oversupply were the problem, you would expect demand per listing to fall as new units dilute the pool. The opposite happened.

Bookings: 529.55K, up 89.33K from the same time last year. That is roughly a 20% increase in demand in a single year.
Occupancy: 57%, up 2 points.
Booking window: 29 days, up 1. Guests are committing further out, not less.
Estimated rental revenue per listing: $49.30K, up $1.12K. RevPAR: $151, up $3.
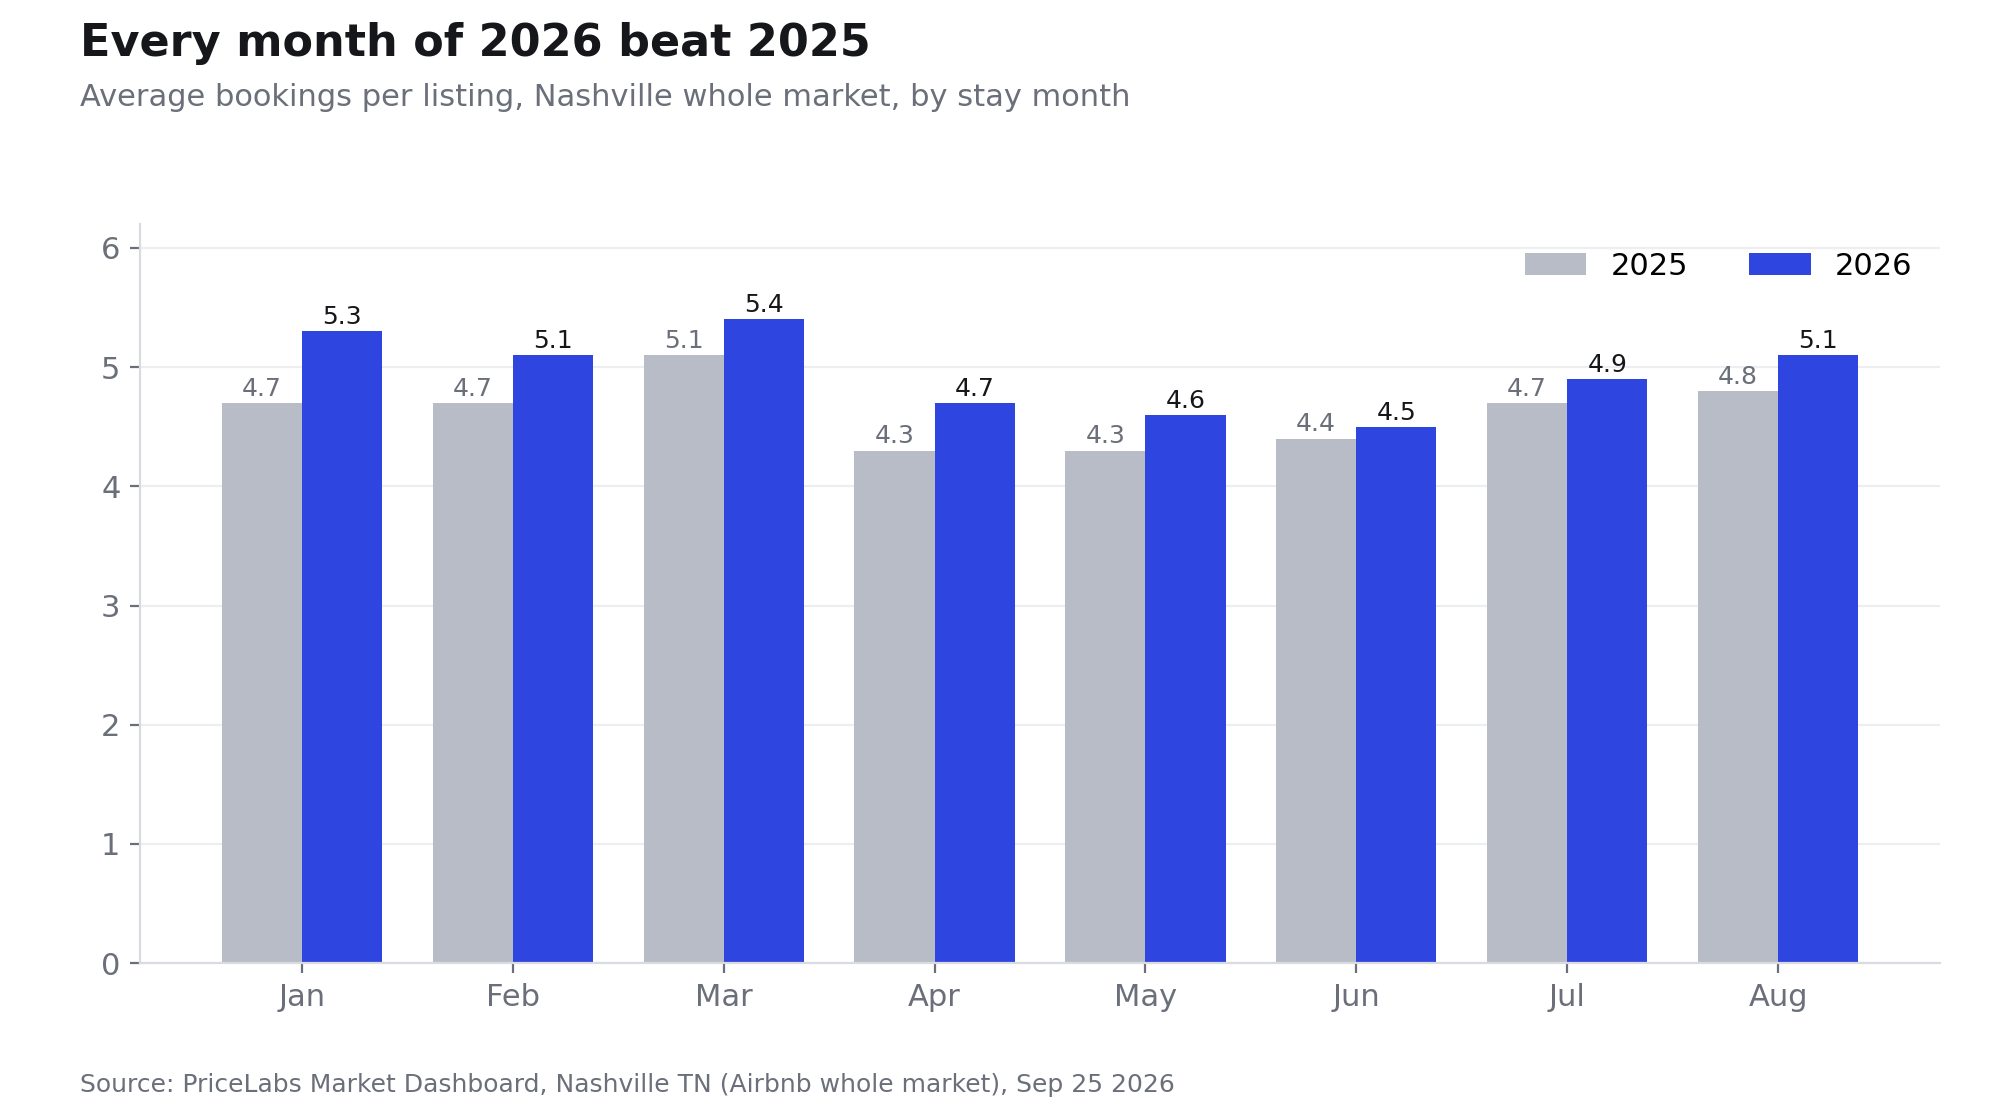
And it was not one lucky month. Measured by average bookings per listing, every single stay month of 2026 so far beat the same month of 2025.
So why didn't rates go up?
This is the part of the conversation that actually matters, and it has nothing to do with how many STRs are in Nashville.
In a normal cycle, 20% more demand on flat supply pushes rates up. Instead, ADR slipped from $269 to $267. RevPAR and revenue barely moved. The reason is the environment every guest and every owner is operating in right now.
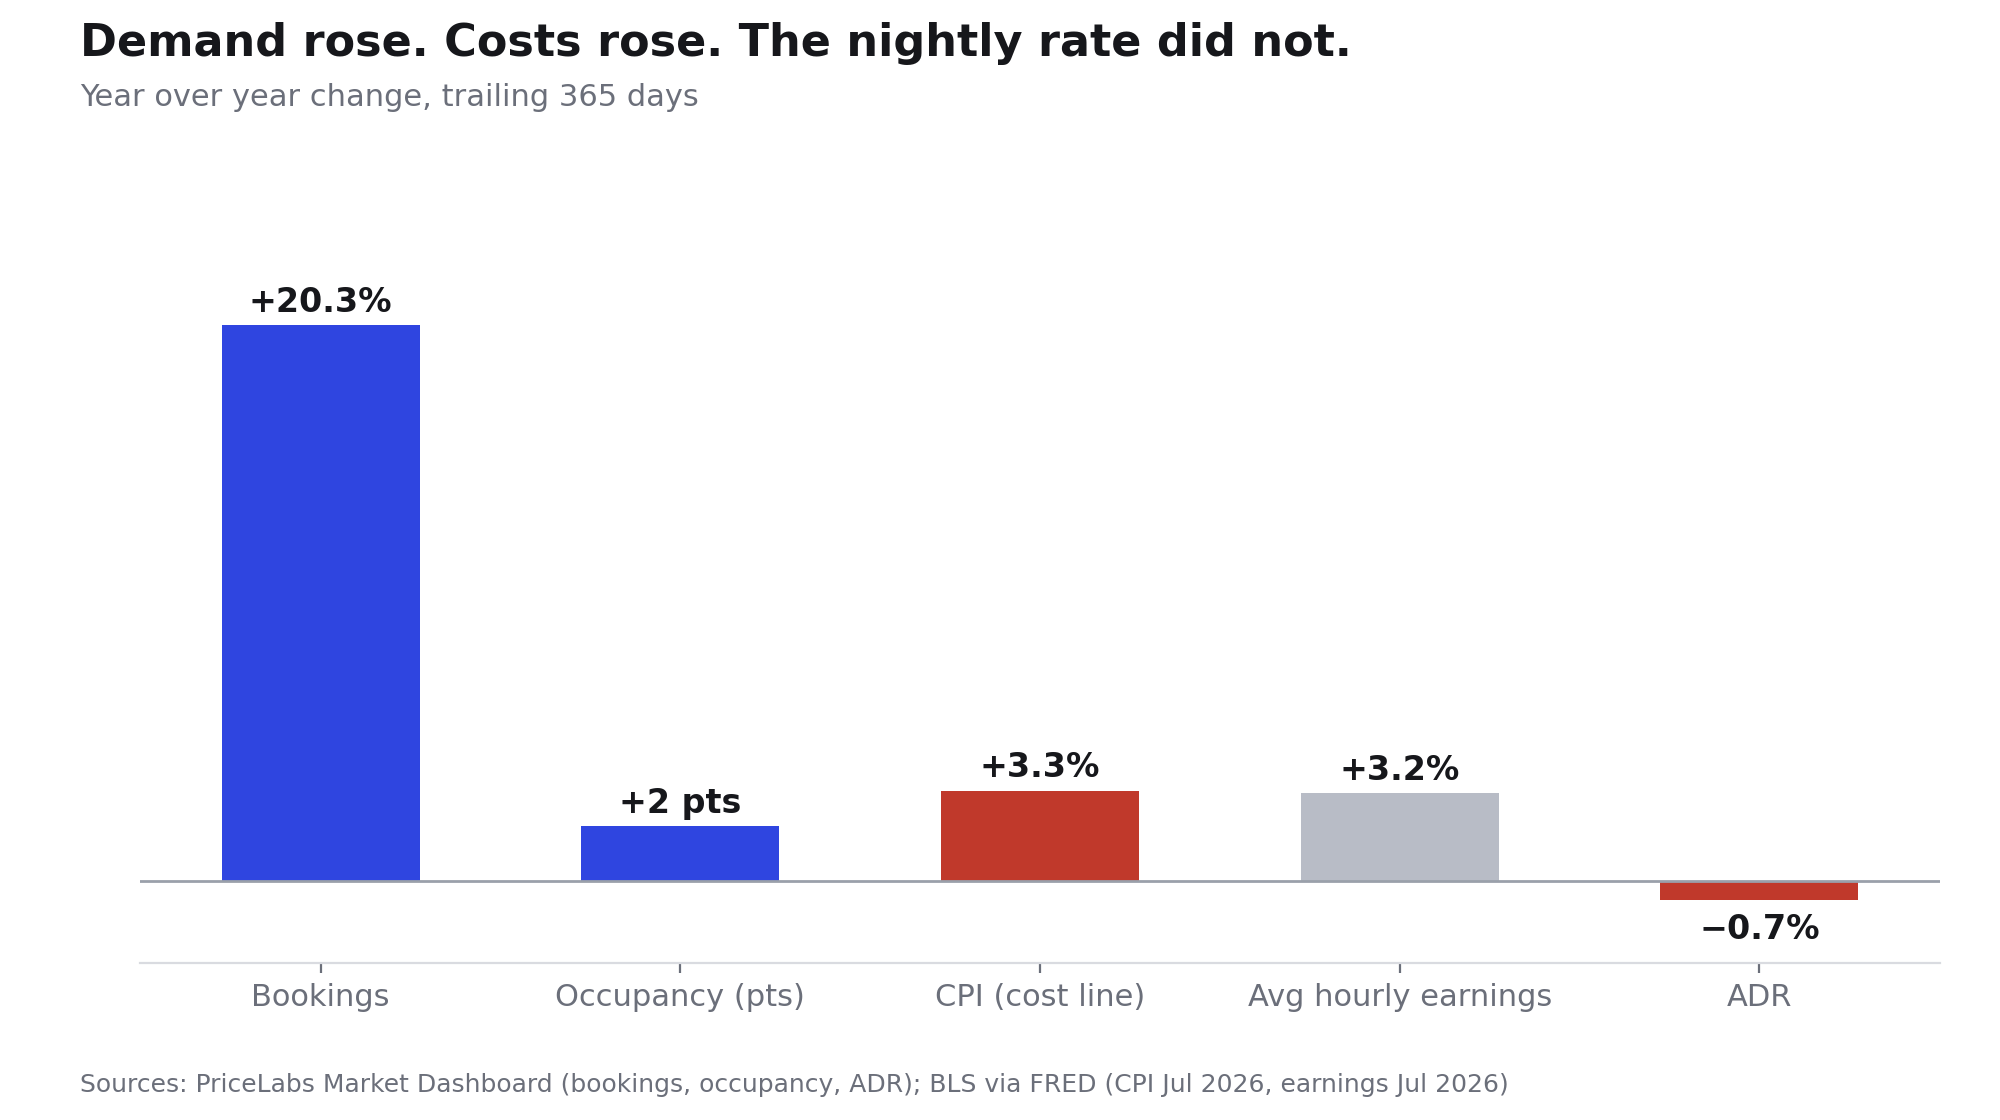
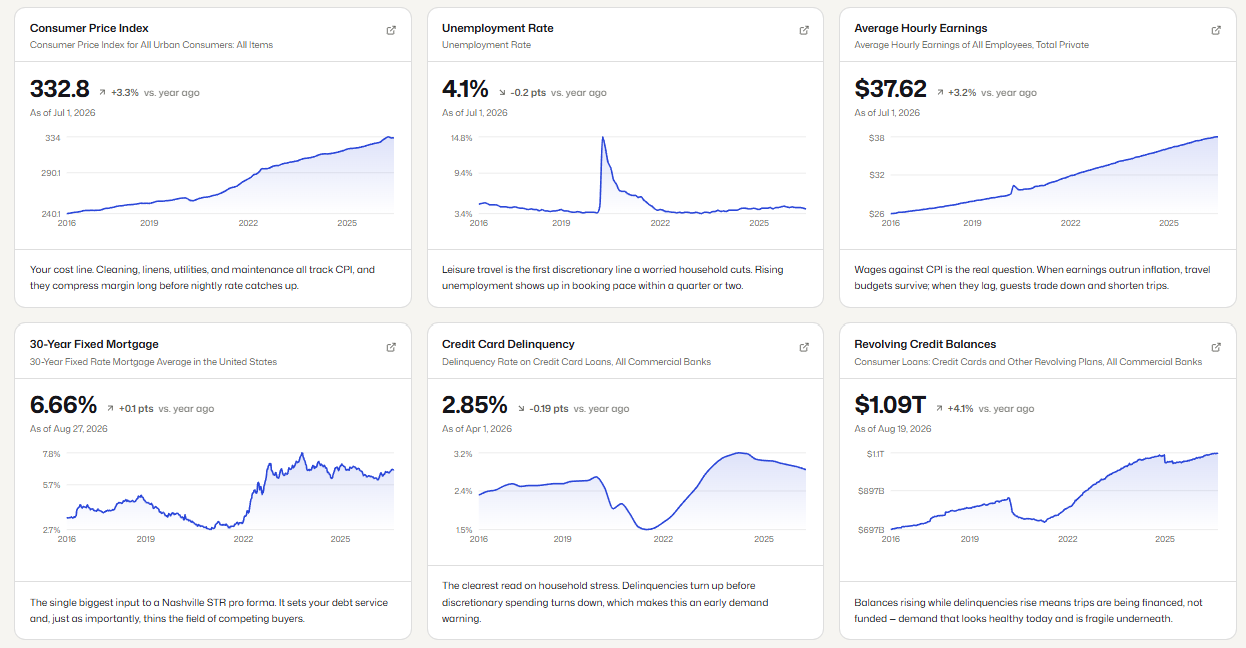
A few things jump out:
Costs are up 3.3%. Cleaning, linens, utilities, and maintenance all track CPI. A flat ADR in a 3.3% inflation year is a real rate cut of roughly 4% for owners.
Wages are up 3.2%, just under inflation. Travelers are still traveling, as the booking data proves, but they are not stretching their budgets. They trade down, compare harder, and book the value option.
Revolving credit balances are up 4.1% to $1.09 trillion. A meaningful share of leisure travel is being financed. That supports volume and caps what guests will pay per night.
The 30 year mortgage is 6.66%. Nashville's STR market was built in a world of 3% money. Debt service on anything bought in the last few years is heavier, which makes flat revenue feel worse than it is.
That is the real story. Nashville is not drowning in STRs. Nashville is operating through a price sensitive, cost heavy, high rate economy, and the nightly rate is absorbing the pressure. Rates did not fall because too many hosts showed up. Rates stalled because guests are more careful with every dollar, while more of them are coming than ever.
What Google Trends actually tells you
Someone will inevitably send you a chart of search interest for "Airbnb Nashville" and call it proof that the party is over. Here it is.
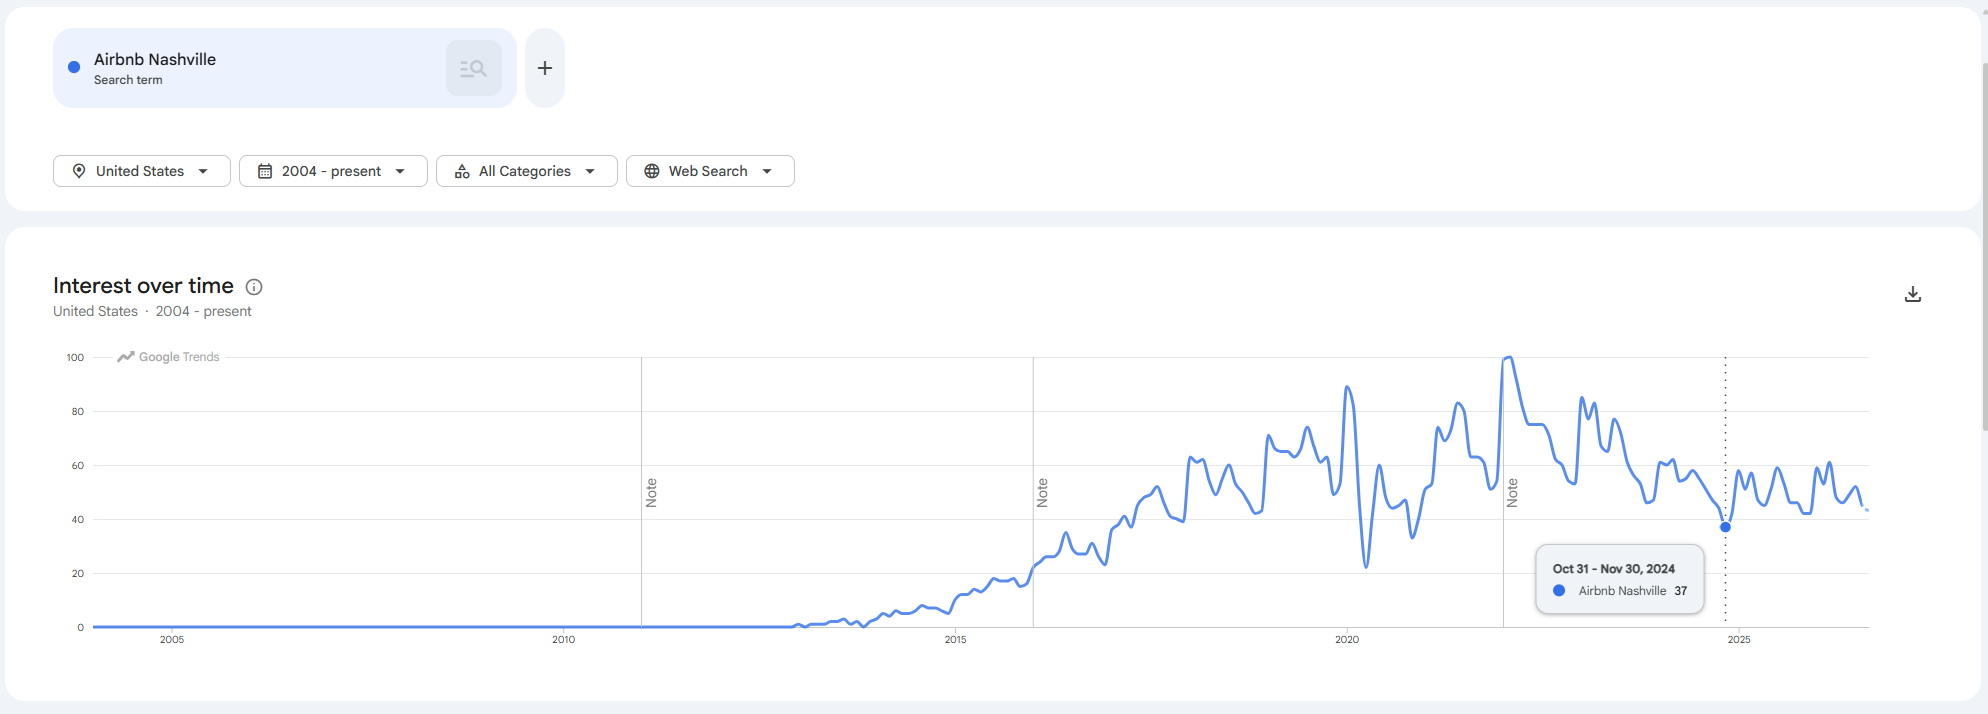
Search interest for that phrase peaked around 2022 and has settled lower since. But search interest is a measure of how people search, not how many people stay. Travelers now open the apps directly, book through Vrbo and direct booking sites, and search for the neighborhood or the trip rather than the platform. Meanwhile, the booking data above shows more stays, not fewer.
Now look at what people search when they are actually coming to town.
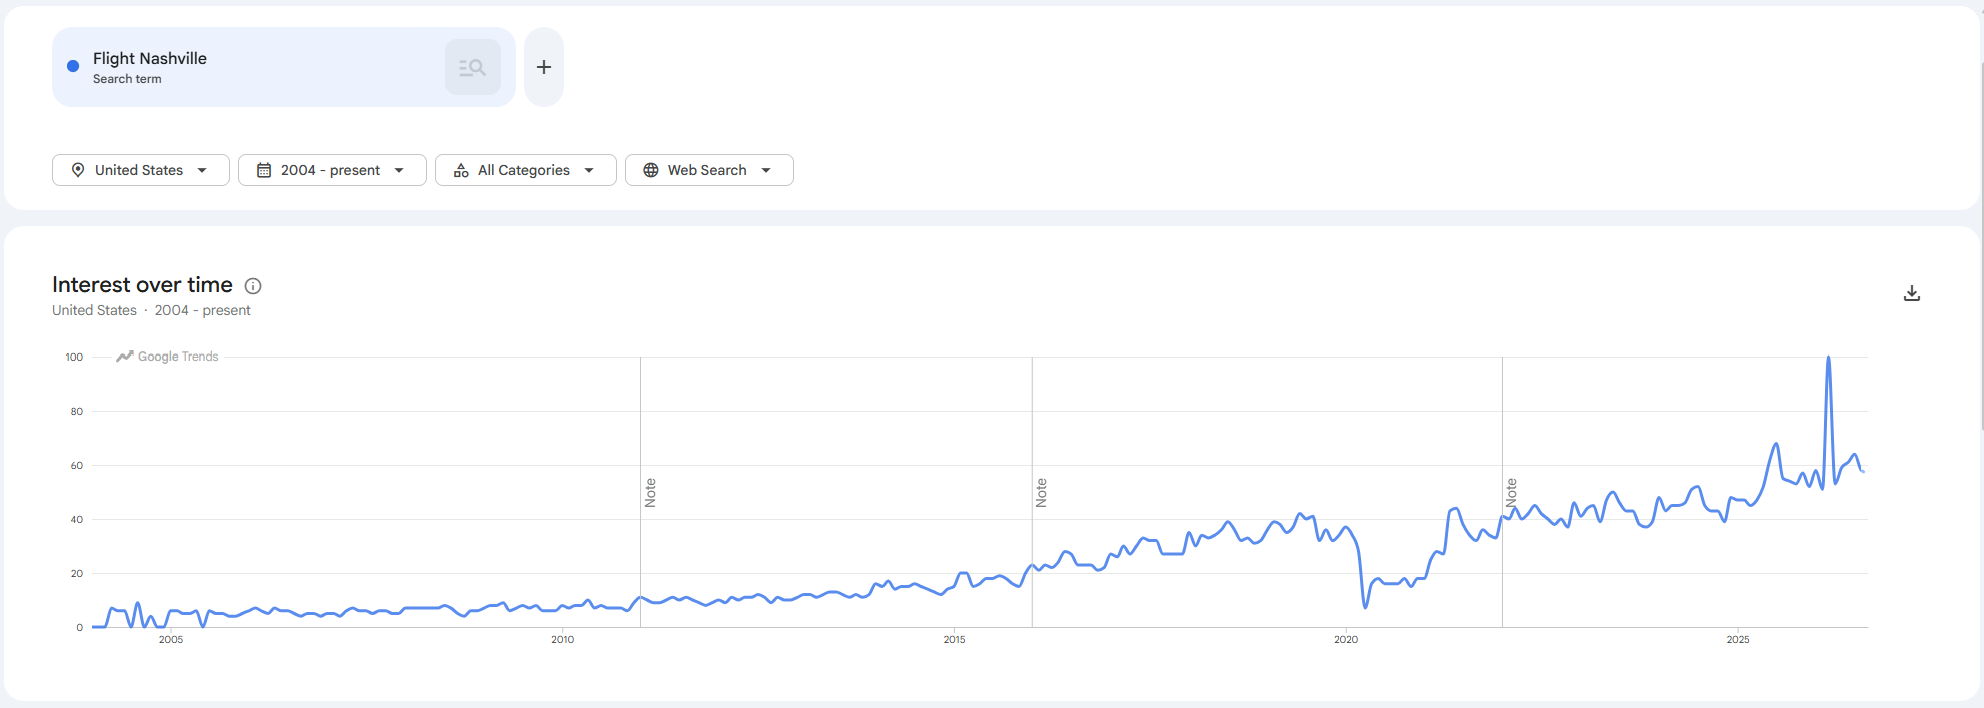
Interest in flights to Nashville is at the highest level in the history of the data. People are not losing interest in Nashville. They are coming in record numbers and shopping more carefully once they land on a booking site.
What it means if you own, or want to own, a Nashville STR
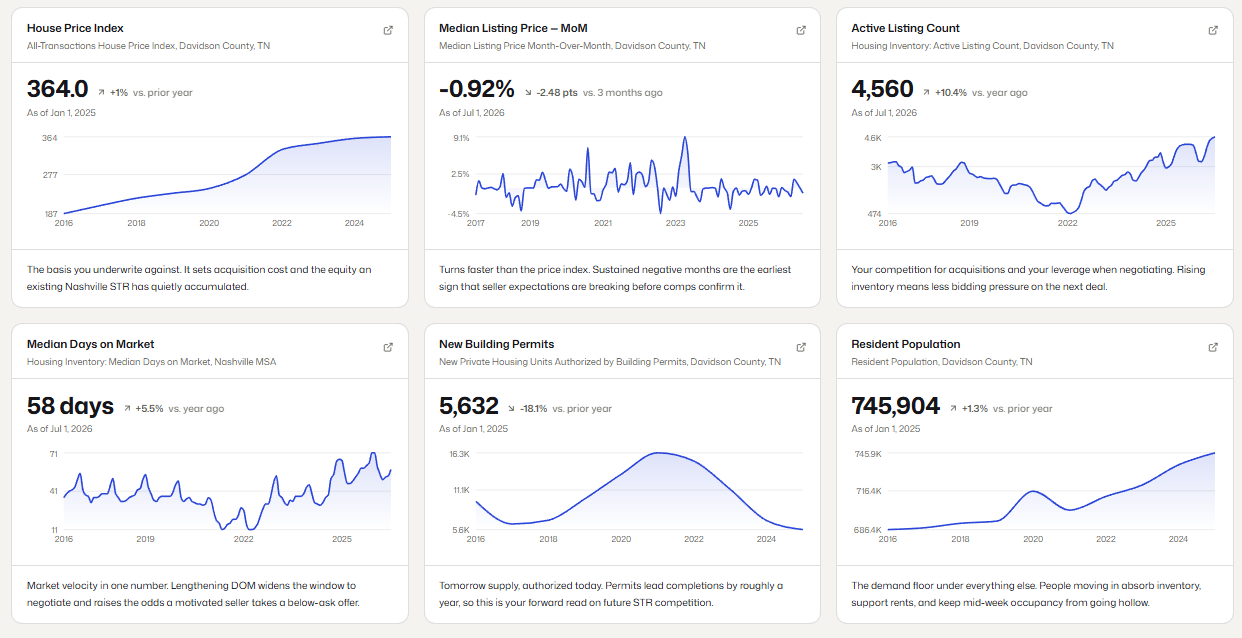
For current owners: the demand is there. Your job right now is capturing it at a price guests will accept, and running tight on costs. Dynamic pricing is no longer optional: in the PriceLabs data, listings with high dynamic pricing make up 59% of listings but capture 72% of bookings. Weeknights are where the money is hiding. Friday and Saturday run 74% and 75% occupancy; Monday and Tuesday sit around 42% and 43%. If you do not want to run that pricing desk yourself, that is the core of what our Nashville Airbnb management service does.
For buyers: this is the most favorable setup Nashville investors have seen in years.
The permit base is shrinking, and 1,215 permits come up for renewal in the next 90 days. Every lapse is one less competitor.
New housing construction is down 18.1%. Fewer new units today means less future supply tomorrow.
Homes for sale are up 10.4% and sitting 58 days, up 5.5%. More inventory and longer days on market means real negotiating leverage.
Population is still growing, up 1.3% to 745,904. That is the demand floor under everything.
6.66% mortgages thin the field of competing buyers. The people crowding every deal in 2021 and 2022 are mostly gone.
Looking ahead: Q4 is pacing ahead
The forward data points the same direction. Occupancy already on the books for October through December 2026 is running ahead of where it was at this exact point last year: about 27% on the books versus 24% a year ago across the quarter, with November and December showing the widest lead.
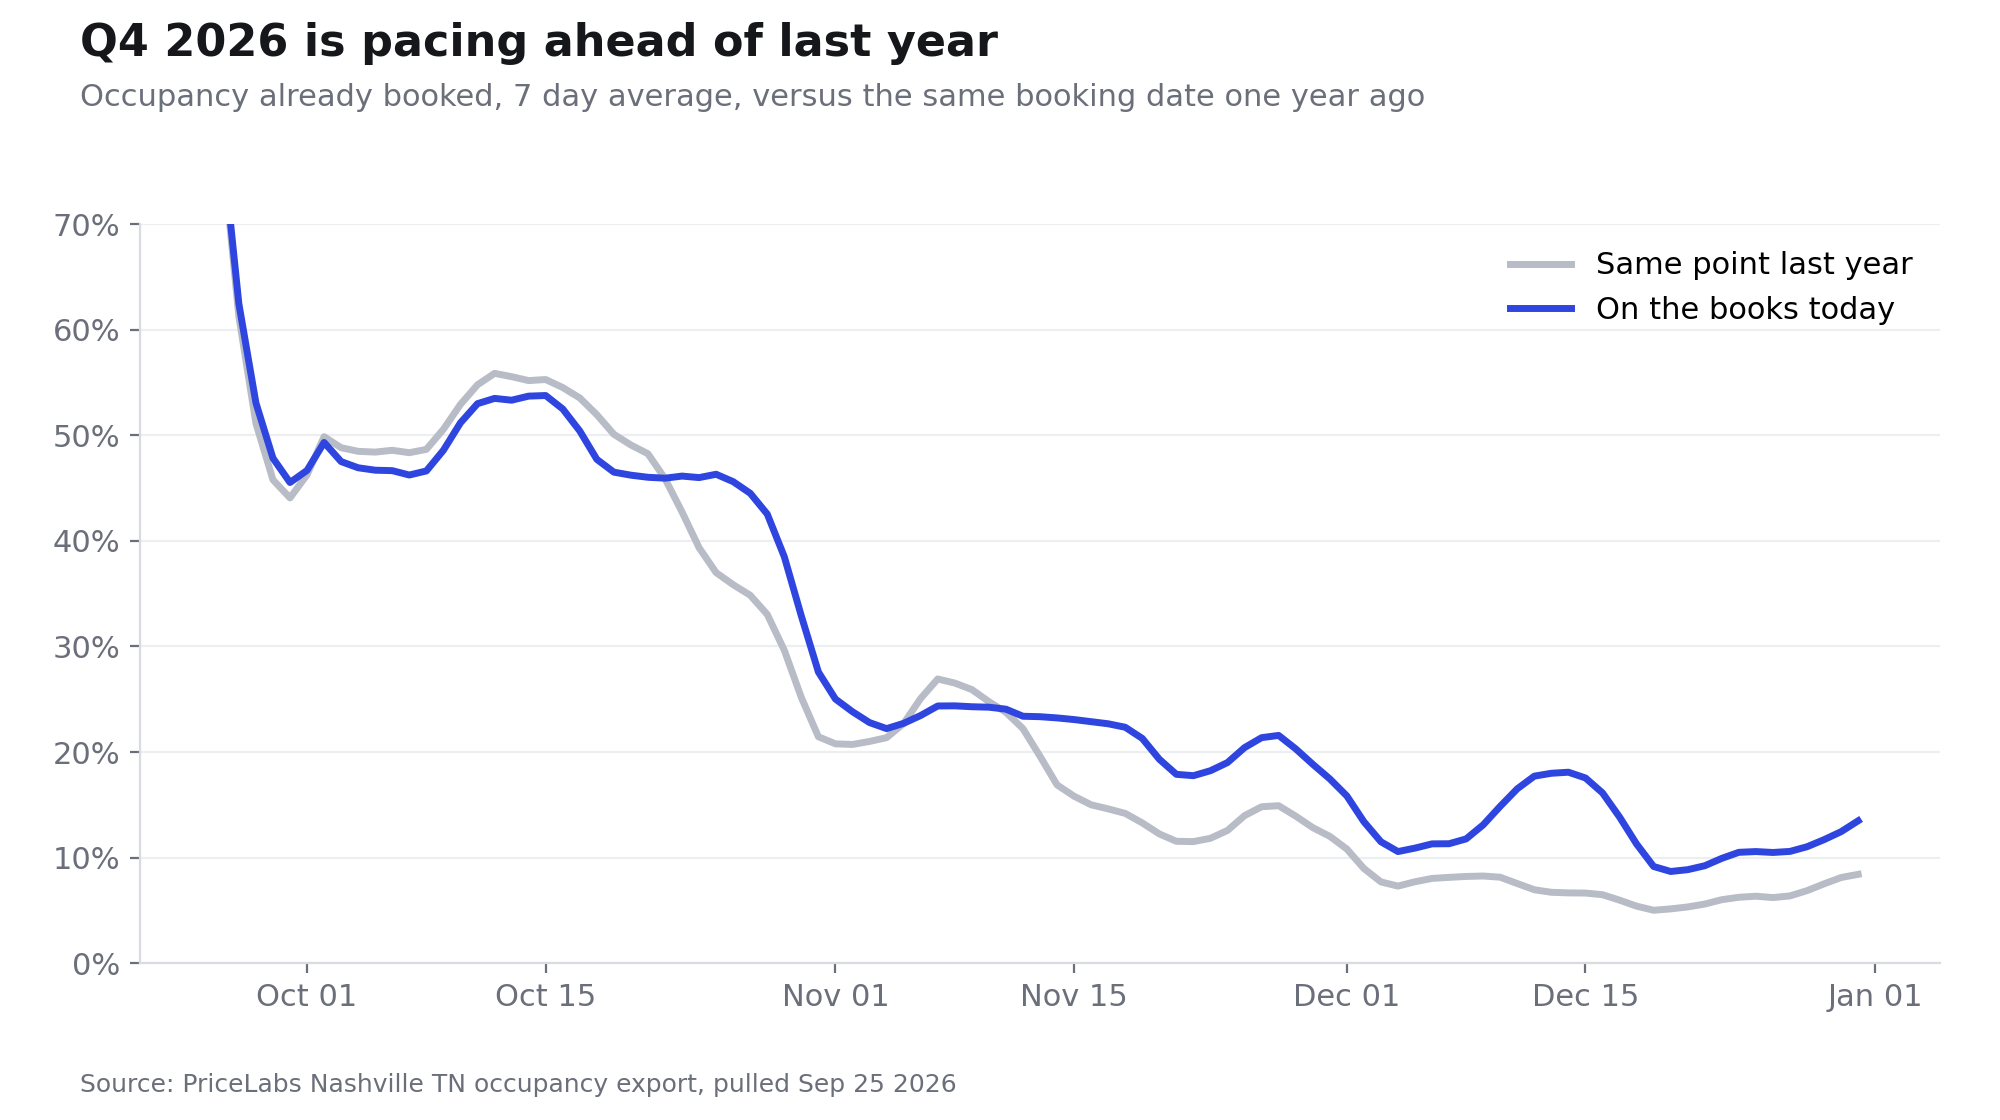
The busiest windows showing up right now, measured against surrounding dates:
October 22 to 24: 17.4% higher occupancy
October 9 to 11: 14.5% higher
December 9 to 12: 12.6% higher
November 24 to 26: 10.6% higher
December 29 to January 1: 8.6% higher
If you own in Nashville, those are the nights to price with conviction.
The bottom line
Nashville does not have an oversupply problem. Legal STR supply fell by 232 permits in the last year. New permits are down a third. Guests booked about 20% more than they did a year ago, and every month of 2026 beat 2025.
What Nashville has is a pricing problem created by the macro economy: travelers who are coming in bigger numbers but spending more carefully, and owners whose costs are rising faster than their rates. That calls for sharper pricing, tighter operations, and patience, not panic.
The owners who mistake a macro squeeze for a supply glut will sell. The ones who read the data correctly will be buying from them.
Data sources: PriceLabs Market Dashboard, Nashville TN, Airbnb whole market, created September 25, 2026 (KPIs compare the last 365 days to the same time last year); PriceLabs Nashville TN occupancy export, pulled September 25, 2026; Metro Nashville Open Data, Residential STR Permits, latest city sync; Google Trends, United States, 2004 to present; FRED (Federal Reserve Bank of St. Louis) series for CPI, unemployment, average hourly earnings, 30 year fixed mortgage, credit card delinquency, revolving credit, FHFA house price index, Realtor.com inventory and days on market, new private housing permits, and Davidson County resident population. Percentage change in bookings calculated as 89.33K divided by the prior year figure of 440.22K. Real ADR change estimated as nominal ADR change less CPI change.