
.png)
2026 NASHVILLE STR MARKET REPORT: Stabilization, Supply Contraction, and Rebound Signals
- Alex

- Jan 15
- 11 min read
Updated: Jan 22
EXECUTIVE SUMMARY
Market Overview: A Structural Pivot to Stability
As of January 2026, the Nashville residential and Short-Term Rental (STR) market has successfully navigated a volatile post-pandemic correction and entered a phase of structural stabilization. The period of unbridled inventory expansion that characterized 2023 and 2024 has concluded. Current data indicates that the market has established a durable floor and is beginning a measured rebound. The narrative has shifted from one of "oversupply risk" to "supply absorption," supported by the first year-over-year contraction in active STR listings observed in the current cycle.
While trailing 12-month performance metrics still reflect the pricing adjustments required throughout 2025, leading indicators paint a constructive picture for 2026. The market is rebalancing: marginal inventory is exiting, professional operators are regaining pricing leverage, and demand remains resilient. Specifically, monthly data for January 2026 shows a robust recovery in Average Daily Rates (ADR) compared to the same time last year, signaling that the pricing bottom has passed. This recovery is not speculative; it is driven by fundamental improvements in the supply-demand ratio and sustained interest in Nashville as a premier travel destination.


Key Findings and Rebound Signals
Supply Contraction: For the first time in recent tracking history, monthly active STR listings have declined year-over-year, dropping from 9,920 in January 2025 to 9,812 in January 2026. This 1.1% contraction signals that the market saturation point has been reached and natural attrition is improving the landscape for remaining operators.
Pricing Power Recovery: Historical market data reveals a sharp pivot in pricing strategy. Aggregate ADR for January 2026 has risen to $209, representing a 12.3% increase from the $186 recorded in January 2025.
Occupancy Momentum: Occupancy for New Year's Day 2026 surged to 69.4%, significantly outperforming the 54.0% recorded on January 1, 2025. This year-over-year improvement demonstrates renewed traveler confidence.
Construction Cliff: Federal Reserve Economic Data (FRED) for Davidson County reveals a precipitous drop in new private housing structures authorized by building permits. This ensures that the flood of new inventory that diluted returns in recent years will not be repeated in the near-to-medium term.
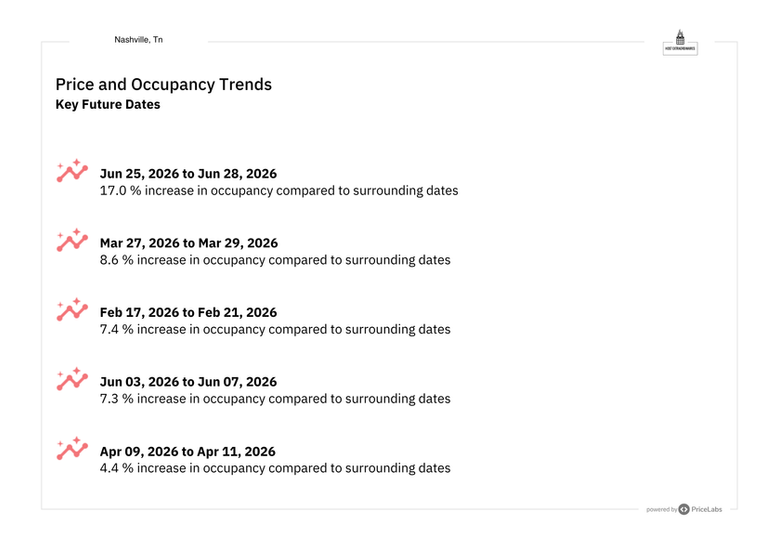
Forward Confidence: Future occupancy data highlights specific demand surges, including a 17.0% increase in occupancy for late June 2026 compared to surrounding dates, confirming robust traveler intent for the upcoming season.
MACRO AND ECONOMIC CONTEXT
Macroeconomic Drivers and Housing Dynamics
The Nashville market is operating within a macroeconomic environment defined by a tug-of-war between labor market resilience and consumer credit constraints. Data highlights that while the unemployment rate remains historically low, supporting stable housing demand, there is a concerning rise in credit card delinquency rates. This divergence suggests a bifurcation in the consumer base: households with asset wealth and stable employment continue to drive real estate and premium travel demand, while the lower-income demographic is pulling back. This necessitates a strategic focus on assets that target financially resilient travelers.
In the residential sector, the "All-Transactions House Price Index" for Davidson County has plateaued rather than crashed, preserving equity for homeowners. However, liquidity has tightened significantly. The "Median Days on Market" metric has climbed to pre-pandemic levels (hovering near 70 days), reflecting a "lock-in" effect where existing homeowners are reluctant to sell due to mortgage rates, and buyers are more deliberate. This slowing of transaction velocity benefits the rental market, as it restricts the flow of turnkey inventory for prospective owner-occupiers, keeping more residents in the tenant pool.
Key Macro Trends and Investor Implications
Supply Pipeline Halt: The sharp decline in building permits is the most consequential macro signal for investors. It effectively places a cap on future competition, turning the current supply overhang into a finite problem that will burn off over the next 12–24 months.
Credit Stress & Spending: Rising delinquencies signal that discretionary travel budgets for the mass market are under pressure. STR assets must deliver tangible value or unique experiences to compete, as the "travel at any cost" mentality has faded.
Wage Support: Continued growth in average hourly earnings provides a fundamental support level for rents and local entertainment spending, preventing a demand collapse.
Inventory Stagnation: With days on market elevated, investors acquiring properties in 2026 have increased leverage to negotiate price and terms, a sharp contrast to the seller-dominated market of 2021.
GOOGLE TRENDS AND BEHAVIORAL DEMAND SIGNALS
Search Intent and Traveler Psychology
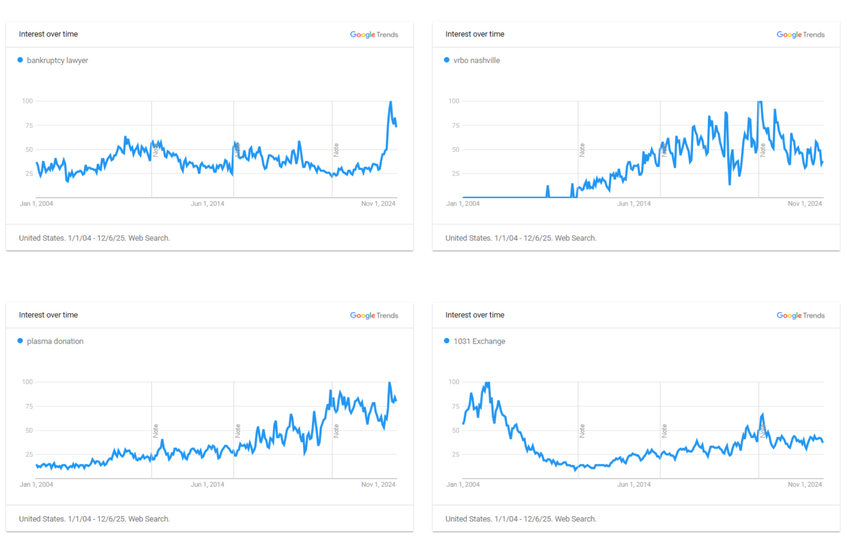
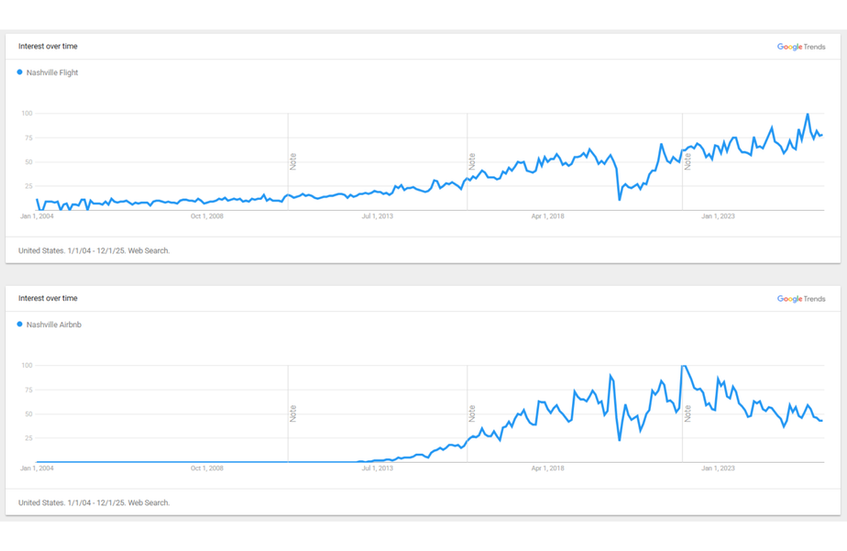
Google Trends data serves as a powerful leading indicator for market health, offering a glimpse into consumer intent before it materializes in booking data. The search trajectory for "Nashville Flight" and "Nashville Events" remains on a long-term upward trend, showing no signs of the secular decline one would expect if the destination had lost its appeal. Instead, the data suggests that interest in visiting Nashville is decoupling from the real estate frenzy; while searches for "Nashville Homes For Sale" have cooled, tourism intent remains at or near all-time highs.
A closer look at platform-specific searches reveals a maturing market. Queries for "Nashville Airbnb" have stabilized after their post-pandemic explosion. This indicates that these platforms have achieved mass adoption; they are now the default standard for many travelers, leading to a steady baseline of search volume rather than exponential growth. However, the simultaneous rise in distress-related searches—specifically "Bankruptcy Lawyer" and "Plasma Donation"—corroborates the macro view of a financially stretched consumer segment. This reinforces the need for defensive investment strategies that avoid reliance on the most price-sensitive travelers.
Behavioral Inflection Points
Destination Durability: The sustained rise in flight and event-related searches confirms that Nashville’s core product—entertainment tourism—is robust and uncoupled from the cooling housing market.
Investor Rotation: Continued interest in "1031 Exchange" searches implies that capital is not fleeing real estate but rotating. Investors are likely seeking tax-efficient entry points into stabilized markets like Nashville following the correction.
Economic Bifurcation: The rise in distress indicators (plasma/bankruptcy) alongside robust travel search volume suggests a "K-shaped" recovery where luxury and mid-tier travel thrives while budget segments face volatility.
Housing Sentiment: The normalization of home sale searches aligns with the stabilization of price indices, suggesting the speculative fervor has exited the market, leaving behind more serious, long-term participants.
HISTORICAL MARKET PERFORMANCE
The Cycle: Peak, Correction, and Stabilization
To contextualize the current rebound, it is necessary to review the market's trajectory over the last five years. The period from 2020 to 2022 was characterized by a "Super Cycle" of appreciation and occupancy, driven by cheap capital and scarce inventory. This was followed by the "Correction Phase" of 2024 and 2025, where a massive tranche of new supply—conceived during the boom—delivered into a higher-rate environment. Active listings surged from roughly 9,000 in early 2024 to a peak of 10,151 in September 2025. This 13% supply shock caused occupancy dilution and a pricing reset.

We are now exiting the trough of that correction. Throughout late 2025 and entering 2026, the rate of change in key metrics began to flatten and reverse. The exponential growth of active listings halted and turned negative. Revenue per unit, while lower than the 2022 peak, stopped its freefall and found a predictable range. The market has effectively "cleared the deck" of irrational exuberance. Current conditions resemble a healthy, pre-pandemic normality where returns are generated through operations rather than automatic appreciation.
Distinguishing Prior Lows from Current Conditions
Inventory Digestion: Unlike early 2024, where inventory was accelerating vertically, current data shows the supply curve rolling over. The peak of 10,151 listings in Sept 2025 has contracted to 9,812 in Jan 2026.
Price Floor: The "All-Transactions House Price Index" has transitioned from a vertical ascent to a plateau. This stability distinguishes the current environment from a crash; equity is being preserved.
Operational Reality: RevPAR and ADR have reset to sustainable levels. The "easy money" premium has evaporated, leaving a market where revenue is closely tied to asset quality and management skill.
Seasonality Returns: The erratic booking patterns of the pandemic era have smoothed into predictable seasonal waves (peaks in May/Oct, lows in Jan), allowing for more accurate financial forecasting.
CURRENT STR MARKET PERFORMANCE
Key Metrics and Revenue Health
Performance data as of January 19, 2026, confirms that the market has found its footing. While the trailing 365-day view shows an 8% decline in Average Daily Rate (ADR) to $253, the short-term trend is the primary rebound signal. Over the last 30 days, ADR has increased by 3% to $227 compared to the previous period. More tellingly, comparing January 2026 directly to January 2025 reveals a 12.3% increase in aggregate ADR ($209 vs. $186). This pivot indicates that hosts are regaining pricing confidence and stepping away from deep discounting.
Occupancy remains the anchor of market health. At 55% over the last trailing year, occupancy has held steady despite the heavy inventory load. This resilience proves that demand growth has kept pace with supply. Revenue per Available Room (RevPAR) for January 2026 stabilized at $65, virtually matching the $66 seen in January 2025, suggesting the bottom has been established. Estimated revenue for the past 30 days was approximately $2,686 per listing, a respectable figure for the seasonally slowest month of the year.
Performance Indicators
Leading vs. Lagging: While trailing 12-month metrics reflect the pain of 2025, the year-over-year monthly jump in ADR ($186 to $209) serves as a leading indicator that the pricing correction has concluded.
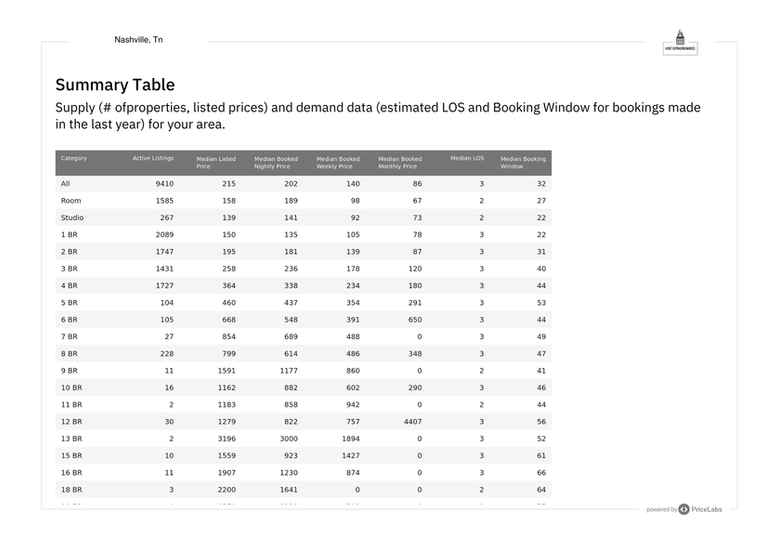
Volume Strength: The market processed over 486,000 bookings in the last year. The sheer depth of this transaction volume validates Nashville as a high-velocity STR market capable of supporting thousands of operators.
Occupancy Floor: The stabilization of occupancy in the mid-50s range provides a clear underwriting baseline for investors. The fear of occupancy collapsing to sub-40% levels due to oversupply has not materialized.
Revenue Seasonality: The data reflects a high-beta seasonal market. Investors must capitalize on the high-revenue months (May, June, October) to build cash reserves for the January-February low season.
SUPPLY AND DEMAND DYNAMICS
The Pivot to Contraction
The defining characteristic of the 2026 market is the structural shift in supply. For years, the headline risk in Nashville was "oversupply." The latest data confirms that this risk is receding. Active listings peaked in the summer/fall of 2025 at over 10,100 units but have since contracted to 9,812 in January 2026. This reduction represents the exit of marginal inventory and non-professional hosts who could not sustain profitability during the pricing correction.
On the demand side, the appetite for Nashville remains insatiable. The "Total Number of Booked Nights" consistently trended upward year-over-year. For example, October 2025 saw 150,109 booked nights compared to 147,444 in October 2024. This relentless demand absorption is the engine of the recovery. With the supply valve tightening (evidenced by the permit crash) and demand continuing its secular growth, the occupancy utilization of the remaining 9,812 units is mathematically poised to rise.
Supply/Demand Takeaways
Supply Cap: The decline in active listings from 9,920 (Jan 2025) to 9,812 (Jan 2026) is the strongest evidence of a market bottom. The saturation phase has officially ended.
Permit Lag Effect: The drop in building permits is a lagging indicator for construction but a leading indicator for future supply. It guarantees that the competitive landscape will not worsen significantly in 2027.
Efficiency Gains: The "Average Bookings per Listing" metric has rebounded from lows of 2.96 in late 2024 to 3.2 in early 2026, signaling that individual unit performance is improving as the herd thins.
Churn Quality: The reduction in listings likely represents the "churning out" of lower-quality product, raising the overall standard of the market and improving the guest experience.

PRICING POWER AND REVENUE QUALITY
Strategic Pricing and Discounting
Pricing power in Nashville has evolved into a tale of two markets: the weekend and the weekday. Data on "Day of Week Price Factors" illustrates extreme elasticity, with Friday and Saturday nights commanding premiums of 229% and 291% respectively against the base rate. This confirms that the "party tourism" demographic remains price-inelastic for peak dates. However, the weekday factor drops to the 160-180% range, indicating that mid-week corporate or leisure travel requires more aggressive incentives.
To combat the ADR compression of 2025, hosts turned to discounting. A significant portion of bookings in the last 30 days utilized monthly discounts, with a notable cluster of bookings capturing 40%+ discounts for long-term stays. This bifurcation suggests that while short-term weekend rates remain high, hosts are effectively using deep discounts to fill calendar gaps with mid-term tenants (29+ days). The recent 12% year-over-year uptick in January ADR suggests that this strategy is working—stabilizing occupancy enough to allow for rate hikes on premium dates.
Revenue Quality Insights
Weekend Dominance: Profitability is heavily weighted toward Friday and Saturday. Investors must optimize operations to ensure 100% availability and perfect execution during these high-value windows.
Discount Dependency: The prevalence of 10-20% weekly discounts and deep monthly discounts proves that "sticker price" resistance exists. Dynamic pricing tools must be configured to automatically apply these incentives to capture volume.
Cleaning Fee Standardization: The clustering of cleaning fees in the $73-$145 range indicates a market standard. Deviating significantly above this range is likely a conversion killer in the current price-sensitive environment.
Rate Confidence: The narrowing gap between the 25th and 75th percentile prices in future months suggests market consensus is forming, reducing the likelihood of destructive price wars.
BOOKING BEHAVIOR AND GUEST PATTERNS
The "Last-Minute" Economy
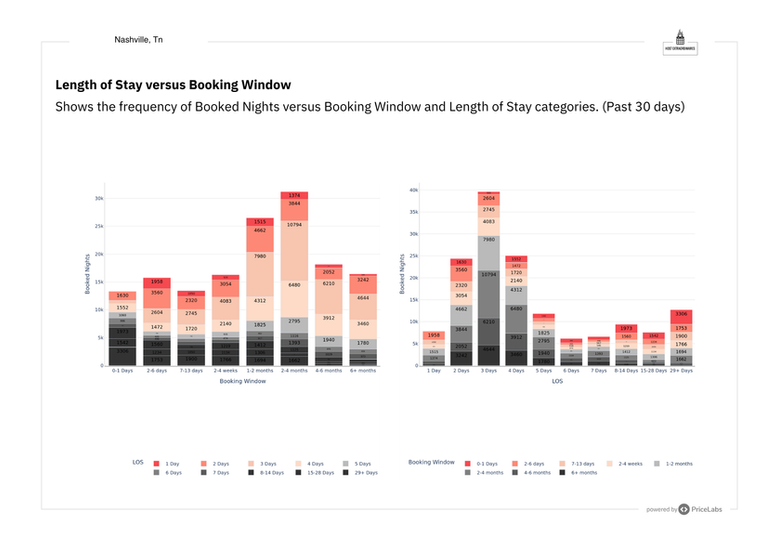
Traveler behavior in Nashville has shifted decisively toward short booking windows. The median booking window currently stands at 32 days for the year, but recent data shows it compressing to just 22 days. The histograms for "Booked Nights" show a massive concentration of volume in the 0-6 day and 7-13 day windows. This trend reflects a broader consumer hesitancy to commit capital far in advance, likely driven by the economic factors previously discussed.
Length of Stay (LOS) data is remarkably consistent, with a median of 3 days. The market is structurally built around the "long weekend" guest. However, there is a "long tail" of demand for 29+ day stays that offers a hedge against high-turnover costs. The correlation between search volume for flights and this short-stay behavior confirms that Nashville is a fly-to destination for specific events, rather than a lingering vacation spot.
Behavioral Trends and Implications
Agility is Key: With a 22-day median booking window, revenue management cannot be passive. Prices must be adjusted daily in the final 3 weeks to capture the bulk of demand.
Turnover Intensity: The dominance of 2-day and 3-day stays means operational costs
(cleaning/laundry) are high relative to revenue. Efficiency in turnover is a major margin driver.
Mid-Term Niche: The existence of a 29+ day booking segment (paired with high discount rates) highlights a viable strategy for investors looking to reduce wear-and-tear and operational headaches.
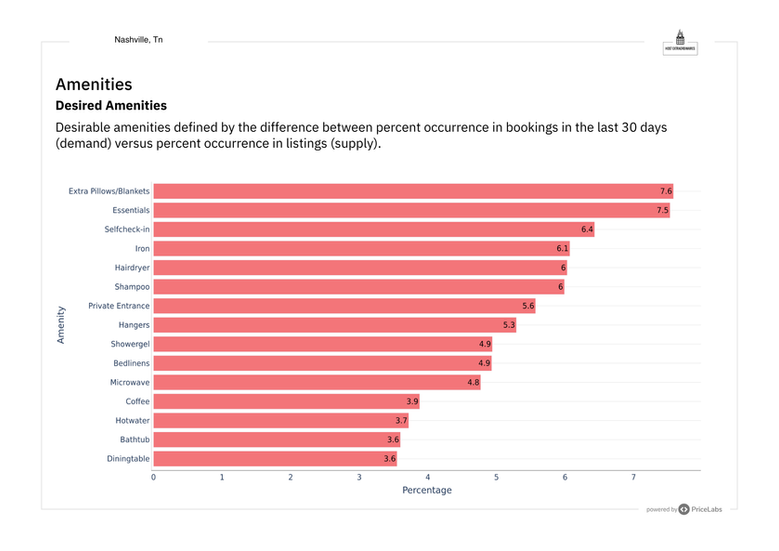
Amenity Priorities: Data shows high booking conversion for listings with "Self Check-in" and "Essentials," emphasizing that guests value friction-less autonomy and basic comforts over complex hosting interactions.


FORWARD-LOOKING INDICATORS
Forecasting the 2026 Recovery
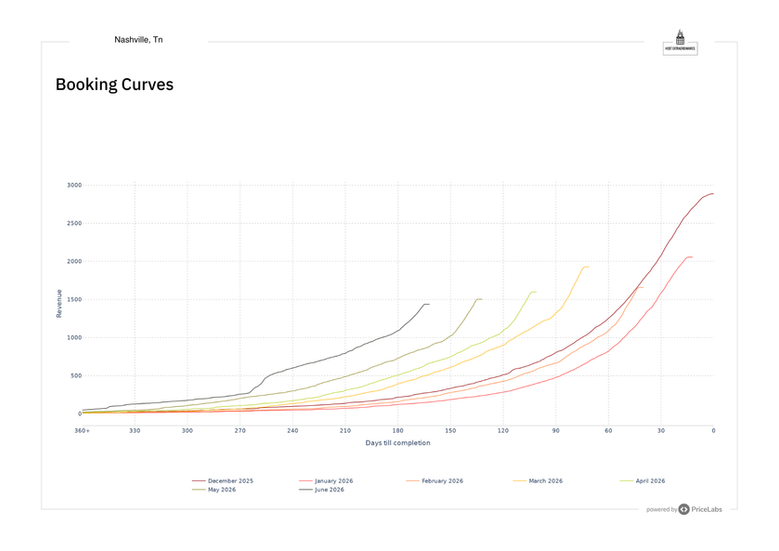
The most bullish data points in the report are found in the forward-looking occupancy curves. PriceLabs data identifies distinct demand poles for 2026 that signal a healthy recovery. Specifically, the window of June 25–28, 2026, is showing a 17.0% increase in occupancy compared to surrounding dates. Similar spikes are visible in February (+7.4%), March (+8.6%), and April (+4.4%). These data points confirm that the event-driven economy is not only active but accelerating.
The "Future Prices" chart shows an upward slope for mid-2026, indicating that hosts are pricing confidently for the summer season. The convergence of pricing percentiles suggests a rational market that has moved past the panic pricing of the correction phase. Furthermore, pacing data (occupancy on the books) for early 2026 is tracking ahead of 2025; specifically, the 15-point jump in New Year's Day occupancy sets a precedent for year-over-year gains throughout the quarter.
Constructive Signals vs. Risks
Event Compression: The identified occupancy spikes confirm that major events continue to drive market-wide compression, allowing for aggressive yield management during these windows.
Seasonal Strength: The pacing for Spring and Summer 2026 is tracking ahead of the soft stabilization period of 2025, validating the rebound thesis.
Pricing Optimism: The upward trend in future listed prices suggests that the market collective believes the supply/demand balance has tipped back in favor of the host.
Visibility Risk: The short booking window remains a risk factor; while the forecast looks good, revenue is not "booked" until the final month, creating cash flow volatility.
INVESTOR IMPLICATIONS AND STRATEGIC TAKEAWAYS
Strategy: Buying the Rebound
The Nashville market has successfully transitioned from a falling knife to a fundamental recovery play. The convergence of contracting supply, stabilizing prices, and robust forward demand creates a compelling "Buy" or "Hold" signal for sophisticated investors. The collapse in building permits is a strategic moat that will protect future cash flows from dilution. However, the market has matured; the "easy money" phase is over, and returns in 2026 will be generated by operational excellence and strategic acquisition.
Investors should focus on assets that can dominate the "short-stay, high-yield" weekend market or pivot to the "mid-term, low-turnover" corporate market. The middle ground—generic, undifferentiated short-term rentals—remains the most competitive and least profitable segment. With days on market for residential sales remaining high (near 70 days), buyers have the leverage to acquire assets at corrected valuations, improving the cap rate potential of the investment.

Strategic Action Plan
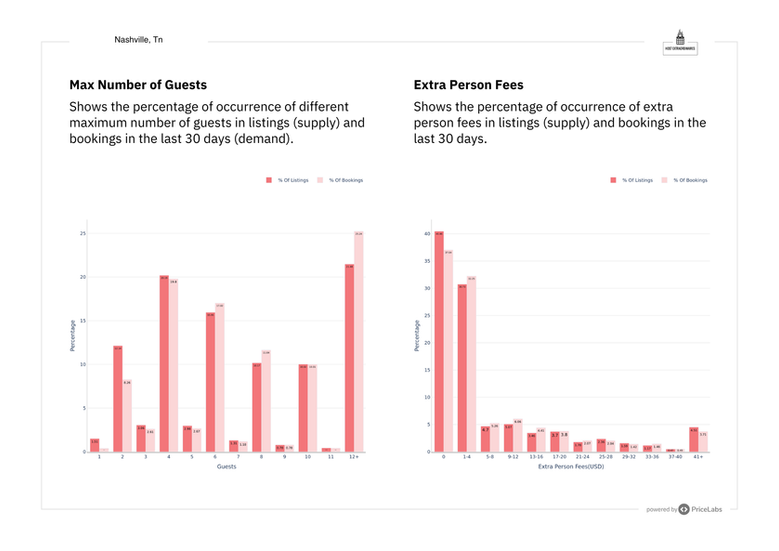
Target Asset Class: Focus acquisitions on properties that accommodate groups (3+ bedrooms) to capitalize on the high-ADR weekend demographic, or unique studios that can compete on price/efficiency.
Operational Rigor: Implement dynamic pricing that reacts to the 0-14 day booking window. "Set and forget" pricing is a failed strategy in this market.
Acquisition Leverage: Use the high "Days on Market" metrics in the sales sector to negotiate aggressive entry prices. The rental market is rebounding faster than the sales market, creating an arbitrage opportunity.
Supply Moat: Recognize that the drop in permits ensures a tighter market in 2027/2028. Current acquisitions are buying into a future supply constraint.
Risk Hedge: Diversify revenue streams by offering monthly discounts to capture the 29+ day guest during the slow months of January and February, stabilizing annual cash flow.


Comments